At SIGGRAPH 2025, a NASA team demonstrated their process for creating large-scale data-driven media that engages with a diverse audience.

Tag
At SIGGRAPH 2025, a NASA team demonstrated their process for creating large-scale data-driven media that engages with a diverse audience.
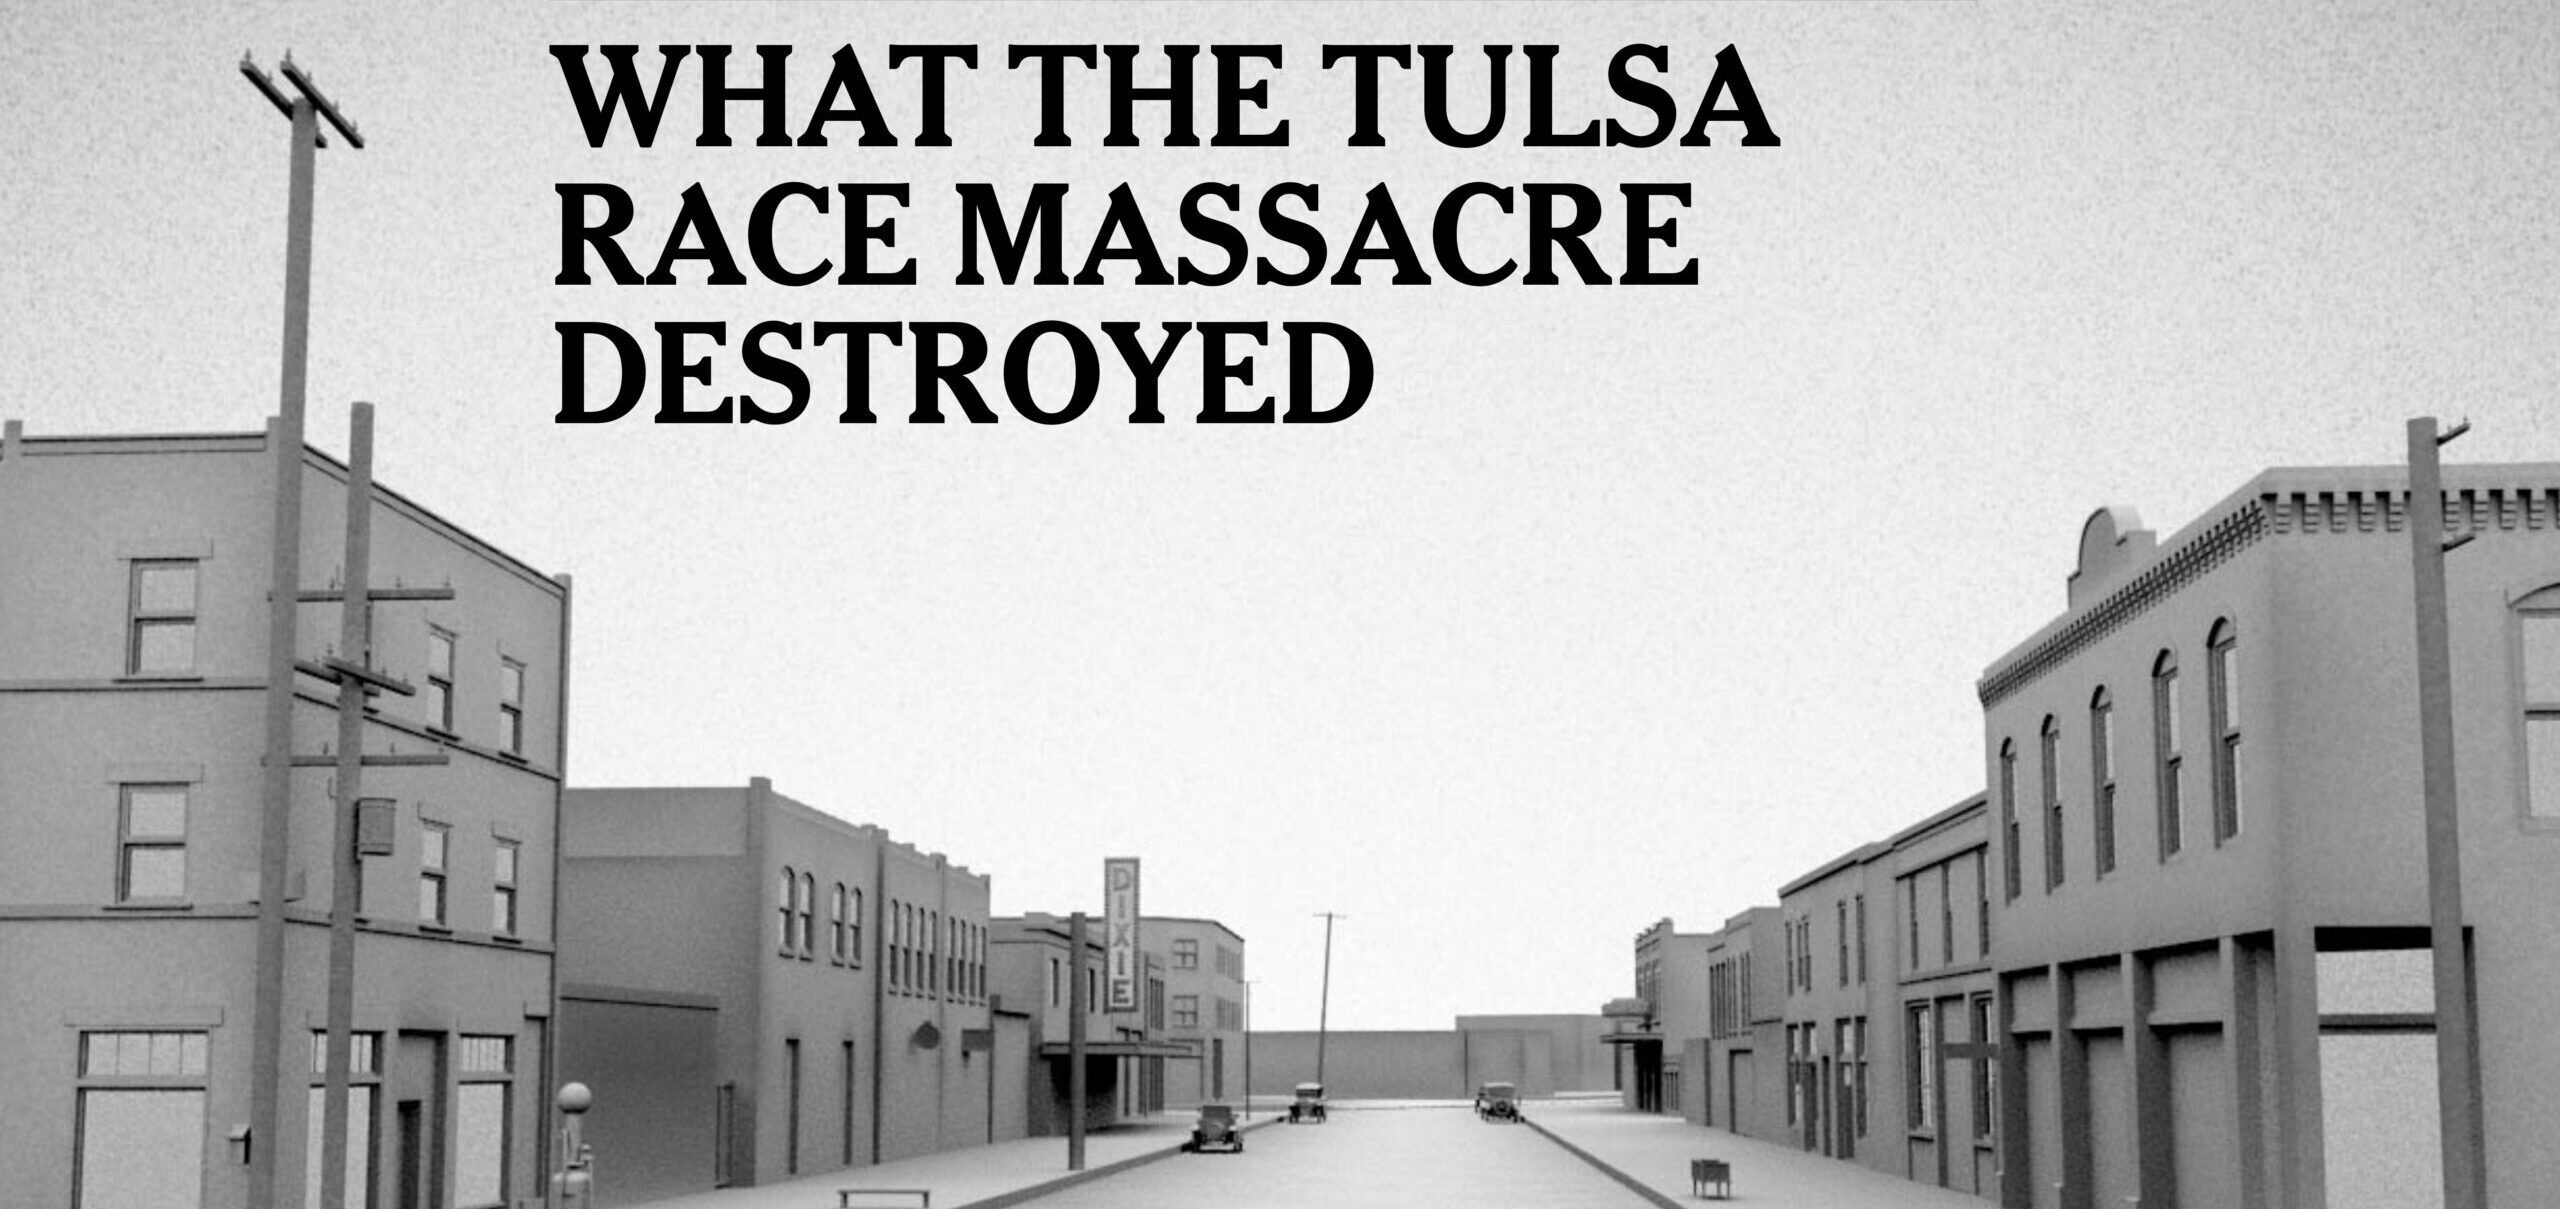
Graphics editors from The New York Times discuss the use of geo-spatial data analysis, 3D, and machine learning to recreate the neighborhood destroyed during the 1921 Tulsa Race Massacre.
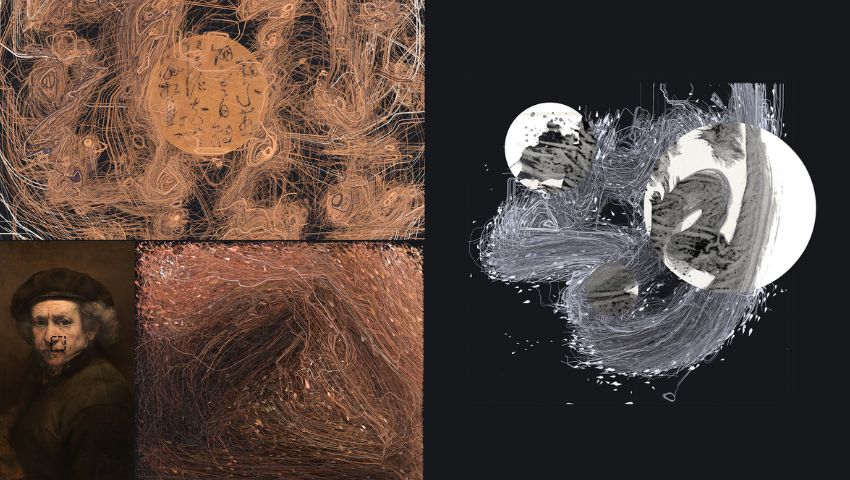
Ruimin Lyu’s research studied brush stroke movement in a quantitative way while providing a new idea of artistic creation.

In this episode of SIGGRAPH Spotlight, four artists discuss how they use data, new realities, and social media to create and distribute their art.
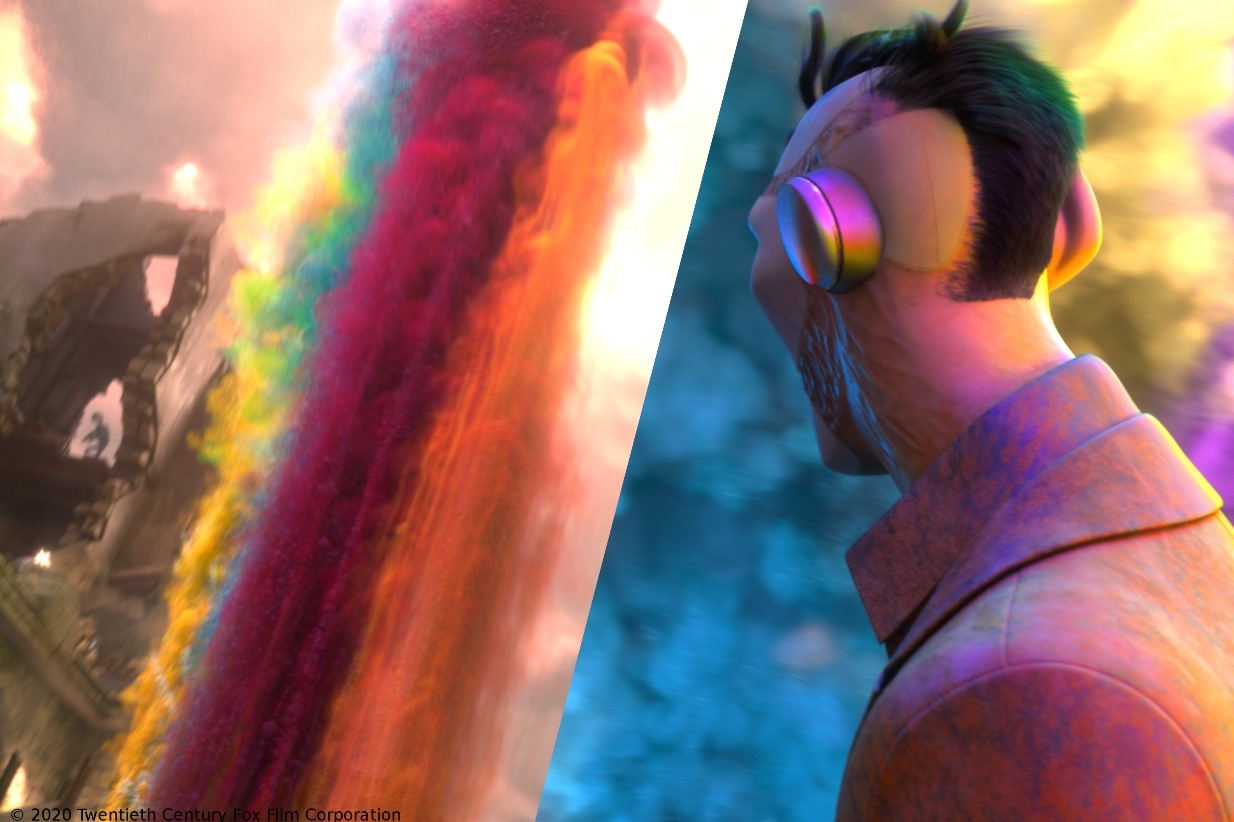
The presenters behind the SIGGRAPH 2020 Talk “Fifty Shades of Yay: A Multi-Shot Workflow from Design to Final” discuss their unconventional process for developing the animation of “Spies in Disguise.”

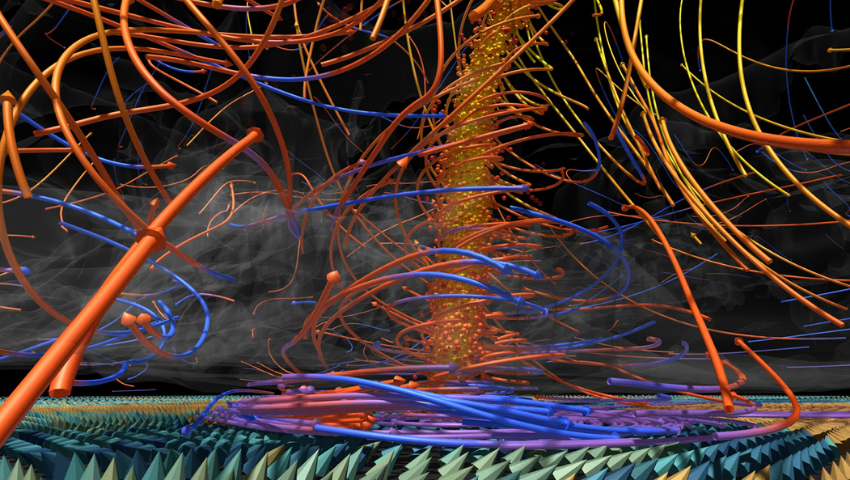
In SIGGRAPH 2020 Art Gallery selection, “Homeostasis,” Emil Polyak uses complex coding and development to narrate the human impact on climate change, as told by data.

A look at a new book on big data and visualization.
Cinematic scientific visualization makes an impact on the general public by delivering cutting-edge science in an artful way.

Image Credit: “PrintCade”, 2014, Jonah Brucker-Cohen, Michael Ang This Q&A is part of a series of interviews with some of the creative minds behind SIGGRAPH 2016. Meet Jonah Brucker-Cohen, Ph.D., SIGGRAPH 2016 Art Gallery Chair. Brucker-Cohen is an award winning...