Data visualization is an exciting subfield of computer graphics, and it can open up a whole new realm of creative possibilities.
ACM SIGGRAPH Blog
Tag
Visualization
A Snapshot View of IEEE VIS 2021
17 November 2021 • by Theresa-Marie Rhyne and Georges HattabArt, Awards, Data, Graphics, Research
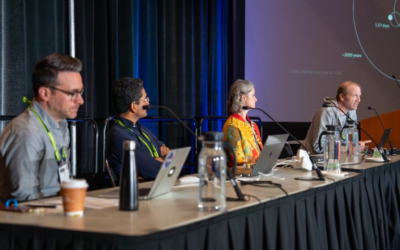
Theresa-Marie Rhyne and Georges Hattab recap the recent IEEE VIS 2021 event.
Breaking Down ‘Inside Hurricane Maria in 360 Degrees’
27 February 2020 • by SIGGRAPH ConferencesAnimation, Conferences, Virtual Reality
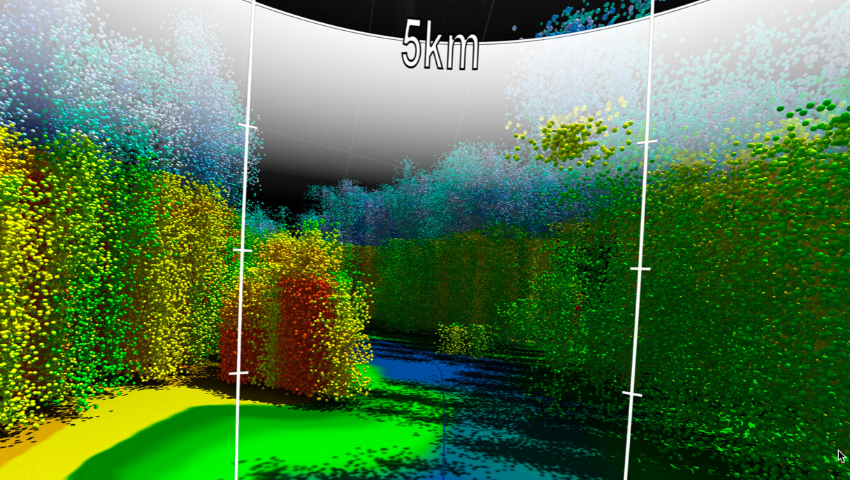
The “Inside Hurricane Maria in 360 Degrees” visualization team breaks down the SIGGRAPH 2019 VR Theater experience.
SIGGRAPH Asia Wrap Up
7 December 2017 • by SIGGRAPH ConferencesACM SIGGRAPH, Conferences
SIGGRAPH Asia 2017 wrapped its 10th edition on a high note. This year’s edition in Bangkok, Thailand brought together some of the biggest names and organizations in the computer graphics and interactive techniques industry from 26 – 30 November 2017. The event drew...
CAD — The Other CG Application
12 January 2024 • by Jon PeddieConferences
While considered mundane, CAD forms the foundation for CG, ensuring photorealistic accuracy in images through its 70-year-old technology.
Fluid, Feminine, and Ecological Data Visualization
6 January 2021 • by SIGGRAPH ConferencesArt, Conferences, Data, Research
Discover the science and method behind student thesis project “Tsuga Convictio”, a 2020 selection of the IEEE VIS Arts Program.
Data Science and Visual Computing
26 December 2019 • by Jon PeddieAnimation, Simulation, Visual Effects
A look at a new book on big data and visualization.
Faces of SIGGRAPH: Nicholas Harvey
5 September 2017 • by ACM SIGGRAPHACM SIGGRAPH, Gaming, Students, Virtual Reality
This Q&A was originally published in the ACM SIGGRAPH Member Profiles. Nicholas Harvey is an aspiring character rigger and animator at the Visualization Program at Texas A&M University. 1. What do you do, and how long have you been doing it? I am an aspiring...
A Journey That Will Melt Even The Coldest of Hearts
19 July 2022 • by SIGGRAPH ConferencesACM SIGGRAPH, Animation, Conferences, Film, Virtual Reality, Visual Effects
“Glimpse” is a sometimes safe, sometimes funny VR journey that will bring you on an emotional trip right to the heart of a relationship.
The Impact of Sound on Surroundings
21 April 2020 • by SIGGRAPH ConferencesAnimation, Art, Conferences, Design, Interactive Techniques, Virtual Reality
Victoria Vesna explores the process and challenges for her SIGGRAPH 2019 installation, “Noise Aquarium,” and how artists and researchers can pivot their work to adjust to COVID-19.
A Snapshot View of IEEE VIS 2019
5 December 2019 • by Theresa-Marie RhyneAnimation, Data, Graphics
Theresa-Marie Rhyne recaps the premiere conference on scientific visualization (SciVis), information visualization (InfoVis), and visual analytics (VAST).
New Generations of Thai Researchers
9 May 2017 • by ACM SIGGRAPHConferences, Research
This year’s SIGGRAPH Asia Conference will take place in Thailand, which has a growing industry and academic research in computer science and engineering. There will be three symposiums, Symposium on Education, Symposium on Mobile Graphics and Interactive Applications,...


