Image credit: scimaps.org
The field of data visualization studies the transformation of data into visual representations. The intent is to provide cost-beneficial means for human users to utilize their perceptual and cognitive abilities to gain insight for the data. Over 30 years ago, in 1987, ACM SIGGRAPH published a landmark report on the subject, entitled “Visualization in Scientific Computing,” in which the National Science Foundation (NSF) Panel on Graphics, Image Processing and Workstations outlined a vision for developing computer-generated visualization as a scientific field. Since that time, visualization has grown into an indispensable and enabling instrument that has expanded to encompass three major subfields: scientific visualization (SciVis), information visualization (InfoVis), and visual analytics (VAST). It also includes numerous domain-specific areas, such as biological data visualization, geo-information visualization, and software visualization. IEEE VIS is the largest worldwide conference on visualization and takes place each autumn. For 2019, the event was held in Vancouver, British Columbia, 20–25 October 2019. Here, I shine a spotlight on some of the memorable content shared during this premiere forum.
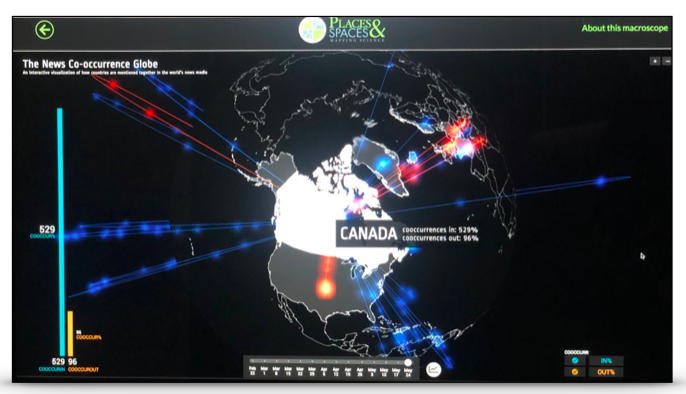
Figure 1: A zoom in on Canada from “The News Co-occurrence Globe – An
interactive visualization of how countries are mentioned together in the world’s news media.”
This shot was demonstrated during the VIS Arts Program (VISAP) reception at IEEE VIS 2019.
Kalev H. Leetaru created the composition. The demonstration was part of the
“Places and Spaces: Mapping Science” online exhibit.
Katy Börner, exhibit coordinator, was the IEEE VIS 2019 Keynote speaker.
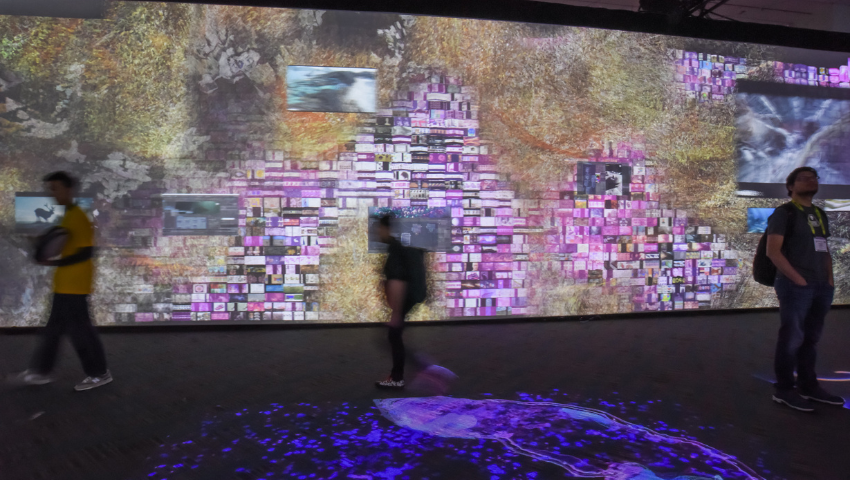
The Venue
IEEE VIS 2019 was held at the Vancouver Convention Centre in its East building. Alex Endert (Georgia Institute of Technology), Brian Fisher (Simon Fraser University), and Wesley Willett (University of Calgary) served as the General Chairs of the conference. The event encompassed a full week of research presentations, tutorials, workshops, panels, demonstrations, posters, arts programs, and exhibitions.
The IEEE VIS 2019 Schedule Shortcut provides a visual overview of the conference, though a more detailed program can also be found on the website.
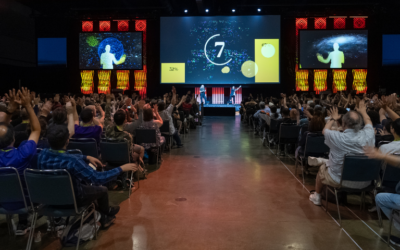
The Keynote
Katy Börner, a distinguished professor of engineering and information science with Indiana University, delivered the Keynote Address on data visualization literacy, or DVL. She noted that, in the information age, “the ability to read and make data visualizations is as important as the ability to read and write.”
Börner went on to define a theoretical data visualization framework that is intended to allow anyone to render data into insights via temporal, geospatial, topical, and network analyses and visualizations. Check out an online version of her DVL course. Her work was present at other points throughout the week, as well, including via an interactive demonstration of her team’s “Places and Spaces: Mapping Science” during the reception for the conference’s Arts Program. Figure #1, shown above, is an example from the interactive exhibit. Further details on Borner’s data visualization literacy concept can be found in her February 2019 paper in the Proceedings of the National Academy of Sciences of the United States of America.
The Capstone
Johanna Drucker, a professor of bibliographical studies at the UCLA, provided the Capstone Address, entitled “Visualizing Temporality and Chronologies for the Humanities,” where she noted that present visualization methods are not easily suited for establishing foundations for visualizing complex historical events, narrative discussions, or human expressions. She showed three examples — one from news narratives, one focused on mixed historical chronologies, and one centered on an imagined crisis scenario — to illustrate the need for visualizations that depict variable timescales, comparative chronology, and “partial and unfolding temporalities.” She also noted the weakness in empirical methods to depict non-linear and affective information, and discussed how such future visualization systems could be designed.
The Best Papers in VAST, InfoVis, and SciVis
As in previous years, the best paper awards for the three major tracks of the week — VAST, InfoVis, and SciVis — were given. The winners were: “FlowSense: A Natural Language Interface for Visual Data Exploration within a Dataflow System” by Bowen Yu and Claudio Silva (Best Paper, VAST); “Data Changes Everything: Challenges and Opportunities in Data Visualization Design Handoff” by Jagoda Walny, Christian Frisson, Mieka West, Doris Kosminsky, Soren Knudsen, Shellagh Caprendake, and Wesley Willett (Best Paper, InfoVis); and, “InSituNet: Deep Image Synthesis for Parameter Space Exploration of Ensemble Simulations” by Wenbin He, Junpeng Wang, Hanqi Guo, Ko-Chih Wang, Han-Wei Shen, Mukund Raj, Youssef S. G. Mashed, and Tom Peterka (Best Paper, SciVis). View all winners on the IEEE VIS 2019 website. Papers presented at IEEE VIS 2019 are published online at IEEE Xplore and will be formally included in the January 2020 issue of IEEE Transactions on Visualization and Graphics.
The IEEE Visualization Academy and the VGTC-VIS Award
At IEEE VIS 2019, the inaugural members of the IEEE Visualization Academy were inducted. Similar to the SIGGRAPH Academy, the IEEE Visualization Academy recognizes individuals who have made significant contributions to the field of visualization and was established by the IEEE Visualization and Computer Graphics Technical Committee (VGTC) in 2018. The initial 32 inductees are prior and current recipients of the Visualization Career Awards and the Visualization Technical Achievement Awards. During the opening ceremony of IEEE VIS 2019, Thomas Ertl was recognized with the 2019 VGTC Visualization Career Award and Eduard Groller was given the 2019 VGTC Visualization Technical Achievement Award. The VGTC Visualization Career Award recognizes an individual with an extensive career of outstanding contributions in visualization while the VGTC Visualization Technical Achievement award recognizes a seminal technical visualization achievement.
IEEE VIS Restructuring Highlights
The IEEE VIS Executive Committee (VEC) began a conference restructuring task in 2016 with final recommendations being completed and accepted at IEEE VIS 2019. This restructuring organizes the VAST, InfoVis, and SciVis conferences, held during IEEE VIS, under a single umbrella, including paper reviewing and governance. This was an expansive and tremendous effort that is described in detail here. The key item to note is that the papers submission and governance process for the conference will evolve and the transition is expected to be fully completed by IEEE VIS 2021.
An Interesting Find During Conference week
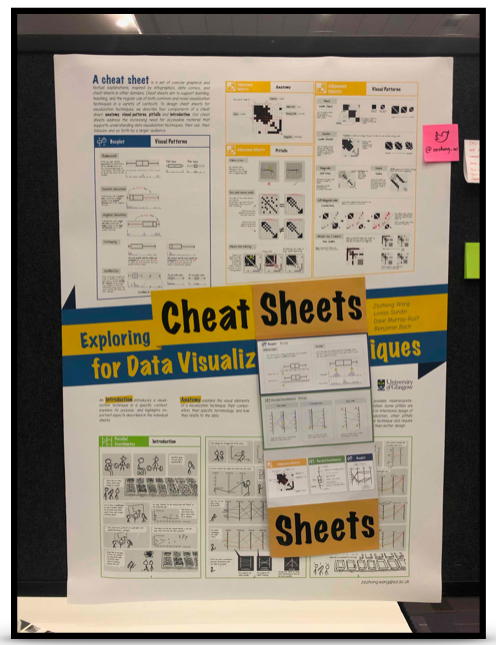
Figure 2: The best InfoVis poster from the IEEE VIS 2019 week was entitled
“Exploring Cheat Sheets for Data Visualization Techniques” by Zezhong Wang, Lovisa Frida Johanna Sundin,
Dave Murray-Rust and Benjamin Bach. We highlight this as interesting find. See further details below.
IEEE VIS 2019 included an extensive poster session that encompassed VAST, InfoVis, and SciVis. The best InfoVis poster award was awarded to “Exploring Cheat Sheets for Data Visualization Techniques” by Zezhong Wang, Lovisa Frida Johanna Sundin, Dave Murray-Rust, and Benjamin Bach. Figure 2 above shows the poster as it was displayed at the conference. As the poster abstract notes, a visualization cheat sheet is intended as a “a set of concise graphical and textural explanations, inspired by infographics, data comics, and cheat sheets from other domains.” The authors intend to address the need for accessible material to support the understanding of visualization techniques, their use, and their pitfalls to a broader audience. More information on the “Cheat Sheets” concept can be found through the video below.
Concluding Remarks
IEEE VIS is the event to attend when it comes to understanding research and application trends in SciVis, InfoVis, and VAST. The next IEEE VIS conference will be held 26–30 October 2020 in Salt Lake City, Utah.