When the Macintosh and Lisa Computers were introduced by Apple Inc. in the early and mid 1980s, it was my good fortune to be a programmer analyst and long range planner with the Center for Information Technology at Stanford University. My day job involved exploring desktop computing challenges while my evenings and weekends were devoted to creating and exhibiting fine art collages. I exhibited artwork along the California Peninsula, from San Francisco to San Jose and even into Santa Cruz, Monterey and Santa Barbara. Looking back, it seems natural that I would try to create fine art with Lisa and Macintosh Computers. But in the 1980s, these desktop devices did not have the computational power to create a multi-layered, multi-colored montage. An artist was forced to be cut and paste resourceful.
My first experiments involved creating designs with LisaDraw software, printing out on white computer paper, photocopying on colorful papers and then creating a montage. I was inspired by Henri Mattise’s paper cut outs in his Jazz (1947) artist’s book. Above, we show an early Lisa / Macintosh collage created in 1984 with a large photographic print of the original image. Both versions were exhibited in fine art shows.
To my amazement, the Lisa and later Macintosh experiments went over so well that I was given a solo art exhibition on the Stanford campus that was noted in Palo Alto and San Jose news publications. In 1985, a few Apple Inc. engineers discovered my work and let me know that their Research Campus had a Color Ink Jet printer connected to Lisa and Macintosh computers. So, I was invited to the Apple Campus to create colorful art using a Black and White high resolution Lisa Computer system with special Lisa Draw software. This software used letters to represent color output. For example, C stood for Cyan, M for Magenta, Y for Yellow, B for Black, G for Green, P for purple, and O for Orange. This was indeed a test of my visualization skills and grounding in color theory.
-
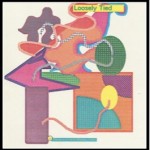
- Lisa/Macintosh Color Study created by Theresa-Marie Rhyne, 1985
-
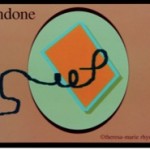
- Undone created by Theresa-Marie Rhyne, 1992
(click the images to see the images with descriptions)
To me, it was a minor miracle when my “Loosely Tied”(Lisa/Macintosh Color Study created by Theresa-Marie Rhyne, 1985) art composition printed out of the color ink jet printer attached to the Lisa Computer. The engineering team and graphic designers at Apple were just as surprised as well.
As the 1990s years went by, the Macintosh computer advanced beyond Black and White with Grayscale to support the Red, Green and Blue (RGB) color model of computer monitors. My career progressed as well. I moved to Research Triangle Park, North Carolina to help set up the United States Environmental Protection Agency’s Scientific Visualization Center. Some said the I moved on to working on high-end Silicon Graphics (SGI) workstations. However, I never stopped my Macintosh color studies, and “Undone” (created by Theresa-Marie Rhyne, 1992) is an example of that work. During this time frame, we were inspired by the art work of Josef Albers, Kenneth Noland, and Frank Stella that we often viewed at the North Carolina Museum of Art.
When the 2000s began, Macintosh laptops allowed for creating digital multi-layer montages and I was in great happiness. At that time, my career had taken me to North Carolina State University where I was a multimedia specialist for a few years and then Director of the Center for Visualization and Analytics. During that time, I had art shows in the Raleigh and Durham, North Carolina area. I was called a Digital Media artist. However, in my mind, I was still experimenting with color on Macintosh computers, of which “Terrain Gallery” (created by Theresa-Marie Rhyne, 2001) is an example.
-
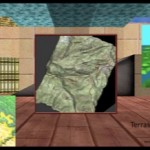
- Terrain Gallery created by Theresa-Marie Rhyne, 2001
-
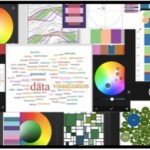
- Data Vis Color Study created by Theresa-Marie Rhyne, 2015
(click the images to see the images with descriptions)
In 2009 and 2010, Macintosh Computers and I had advanced enough that it was possible to visualize data sets and build Web sites with a MacBook. At SIGGRAPH 2009, the International Conference and Exhibition on Computer Graphics and Interactive Techniques, I gave my first talk on “Applying Color Theory to Scientific Visualizations” and attempted to crystalize years of color study. By 2010, I had left my position at North Carolina State University and become a consultant in applying artistic color theory methods to visualization and digital media. Contracts with the University of Utah, University of California at Davis, and Stanford University resulted. My color studies also grew into maintaining a Blog, developing book chapters, creating videos, and teaching short courses on color theory.
Since 2010, my color studies have expanded across the full range of Apple Inc. devices that include the MacBook Air, iPad, and iPhone. We are grateful that cloud computing lets us move seamlessly among these devices. Above, we show a 2015 composition entitled “Data Vis Color Study” (created by Theresa-Marie Rhyne, 2015) where all of the computational, graphic design and color study work was executed on a MacBook Air or related devices such as the iPad and iPhone. Each day, we happily try a new exploration with our color study suite of tools.
 About the Author: Theresa-Marie Rhyne has over twenty-five years of experience in producing and colorizing digital media and visualization. Theresa-Marie is a long time contributor to the ACM SIGGRAPH community with previous service on the ACM SIGGRAPH Executive Committee and on SIGGRAPH Conference Committees. She has organized and taught courses, panels, birds-of-a-feather sessions and other efforts at prior SIGGRAPH events.
Acknowledgements: We thank the many people whom we have known over the years who have shared their enthusiasm and expertise in computer graphics and for our work.