Screen capture of the IEEE VIS 2020 website.
The Venue
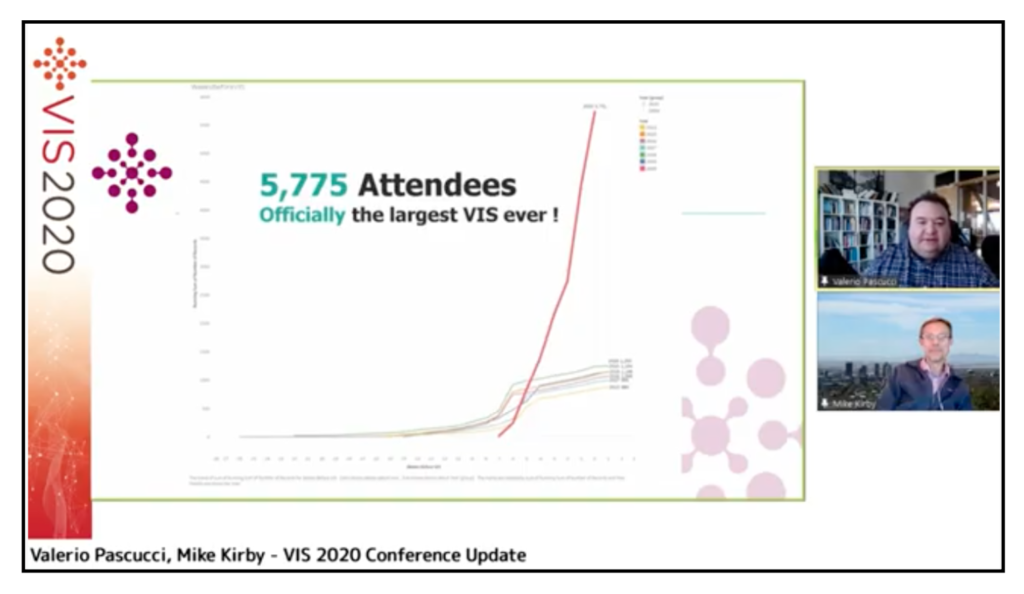
IEEE VIS is the premiere event focused on advances in theory, methods, and applications related to the transformation of data into visual representations. It takes place each autumn. This year, due to COVID-19, the IEEE VIS 2020 forum transformed from a live event slated to be held in Salt Lake City, Utah into a virtual event. As a result of changes in the pricing model, where attendance was free and the costs of participation and publication were covered by contributors, the virtual event was wildly successful. As reported by the Conference Chairs Mike Kirby and Valerio Pascucci, IEEE VIS 2020 had ~5,775 attendees (compared to prior in-person events’ of approximately 1,250 attendees).
In this writing, we provide some background about and a brief snapshot of this leading visualization event.
Some History on Computer-generated Visualization
Over 30 years ago, in 1987, ACM SIGGRAPH published a landmark report on the subject of computer-generated visualization, entitled “Visualization in Scientific Computing,” in which the National Science Foundation (NSF) Panel on Graphics, Image Processing and Workstations outlined a vision for developing computer-generated visualization as a scientific field. The first IEEE VIS conference was held in 1990. Since that time, visualization has grown into an indispensable and enabling instrument that has expanded to encompass three major subfields: scientific visualization (SciVis), information visualization (InfoVis), and visual analytics (VAST). It also includes numerous domain-specific areas, such as biological data visualization, geo-information visualization, and software visualization.
During its opening session, IEEE VIS reflected on research contributions with its Test of Time Awards, honoring the current year’s Best Paper Awards and individual Career and Technical Achievement Awards. As is noted in the “Restructuring and Future Directions” section of this snapshot, much effort has gone into restructuring the IEEE VIS forum into a cohesive umbrella for visualization contributions. This unified event will be retitled as the IEEE Conference on Visualization and Visual Analytics in 2021.
Contests, Symposium, Tutorials, and Workshops
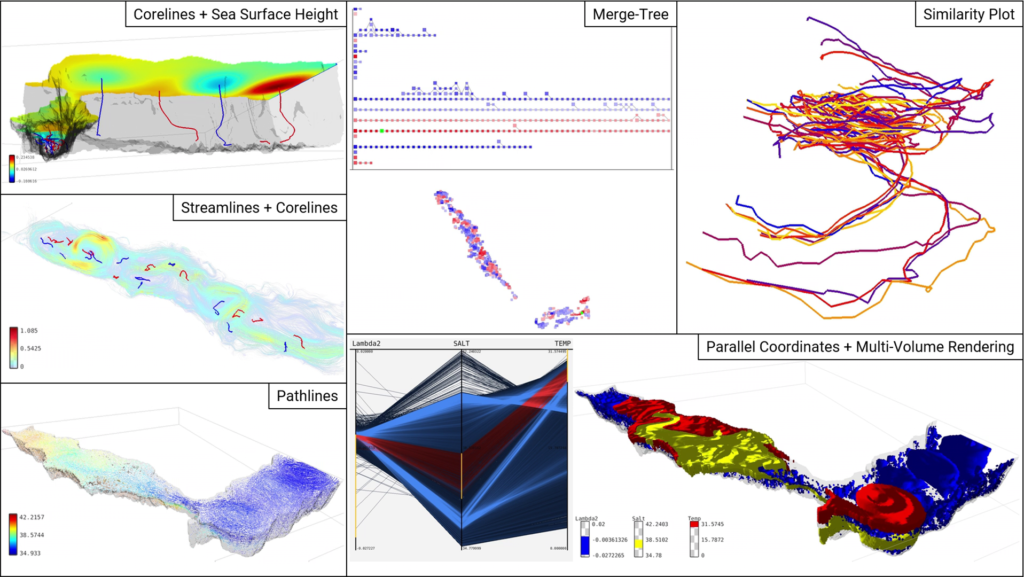
Like the annual SIGGRAPH and SIGGRAPH Asia conferences, IEEE VIS includes contests, symposium, tutorials, workshops,and anarts program(known as VISAP) held during the week. Selecting “Events & Community” from the IEEE VIS 2020 website expands a list of some of the activities held during the virtual event. Then, choosing “Program” opens links to the papers, posters, tutorials, workshops, panels, and application spotlights that were selected or curated for presentation during the week. Below we show an image from the poster of the SciVis Contest 2020 winner, “Interactive Visual Analysis of Oceanographic Simulation Ensemble Data”.
The Keynote: Nobel Prize Awardee Mario Capecchi
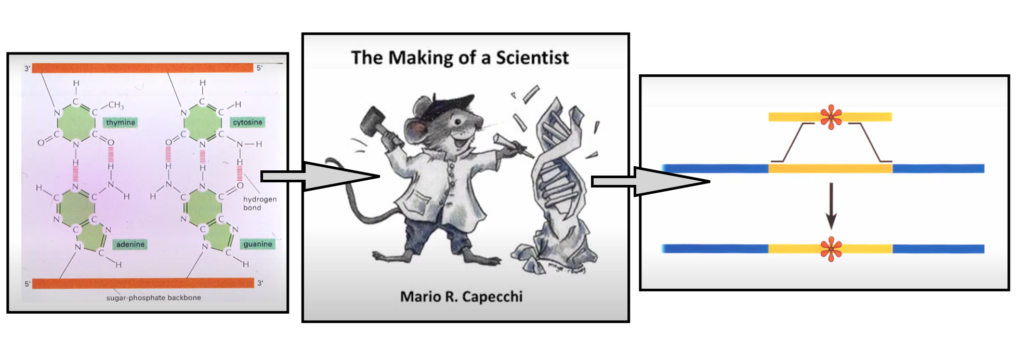
Mario Capecchi, co-winner of the 2007 Nobel Prize in Physiology or Medicine and distinguished professor of human genetics at the University of Utah, gave a virtual keynote on “The Making of a Scientist”. His presentation was divided into three parts: (1) What do I do as a scientist?; (2) A personal journey to becoming a scientist; and, (3) a journey to Stockholm to receive the Nobel Prize.
During the first part, Capecchi described the ups and downs related to his gene-targeting research and noted that “collaboration is stronger than competition”. The second part of the lecture described his personal history. He described his childhood of growing up in Europe and eventually coming to the United States. During the third component of Capecchi’s keynote, he revealed what it was like to go to Stockholm to receive the Nobel Prize. This was a special treat for the audience to see. It is impossible to describe the rich content in this outstanding keynote session, so we’ve embedded the full recording below.
The Capstone: Sheelagh Carpendale
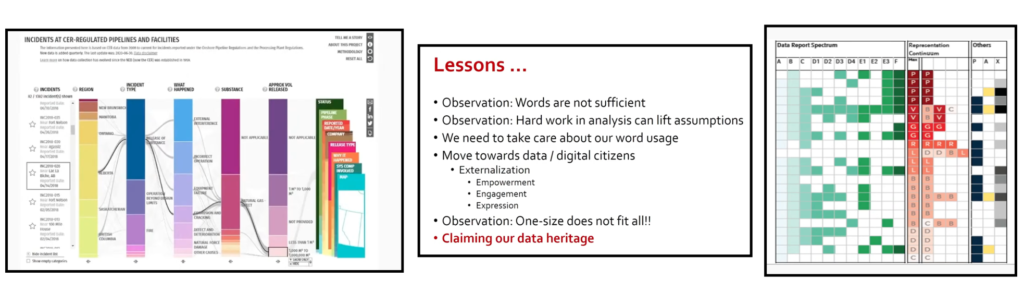
Sheelagh Carpendale, recipient of the 2018 IEEE Visualization Career Award and professor and Canada Research Chair in information visualization at Simon Fraser University, was the event’s closing Capstone speaker. Her address covered “Data VIS for Empowerment and Inclusion”. She touched on a few moments in her personal visualization research history that changed her way of thinking and eventually resulted in her current position. Six lessons were noted:
- Words are not sufficient;
- Hard work in analysis can lift assumptions;
- We need to take care about our word usage;
- Move toward data / digital citizens;
- One size does not fit all; and,
- Claiming our digital heritage.
Similar to the keynote presentation, it is not possible to describe the thoughtful commentary in this terrific capstone session. If you have time, watch a full recording of the session.
Noteworthy Highlights
The BioVis@Vis workshop celebrated 10 years! For the program, a capstone address was given by Nils Gehlenborg of the Harvard Medical School Department of Bioinformatics, entitled “10 Years of BioVIs – Past, Present, Future: A Personal View”. During the address, Gehlenborg highlighted integrative visualization tools that facilitate the data exploration of multimodal data. Additionally, he pointed out that, ultimately, great exploratory tools will become obsolete when they are not complemented by algorithms that support usability. Moreover, he stressed the need for researchers to have multiple hats and understand the challenges the BioVis community faces across different domains: computational biology, bioinformatics, data visualization, and human-computer interaction.
During the VIS Full Papers sessions, many notable works caught our attention.
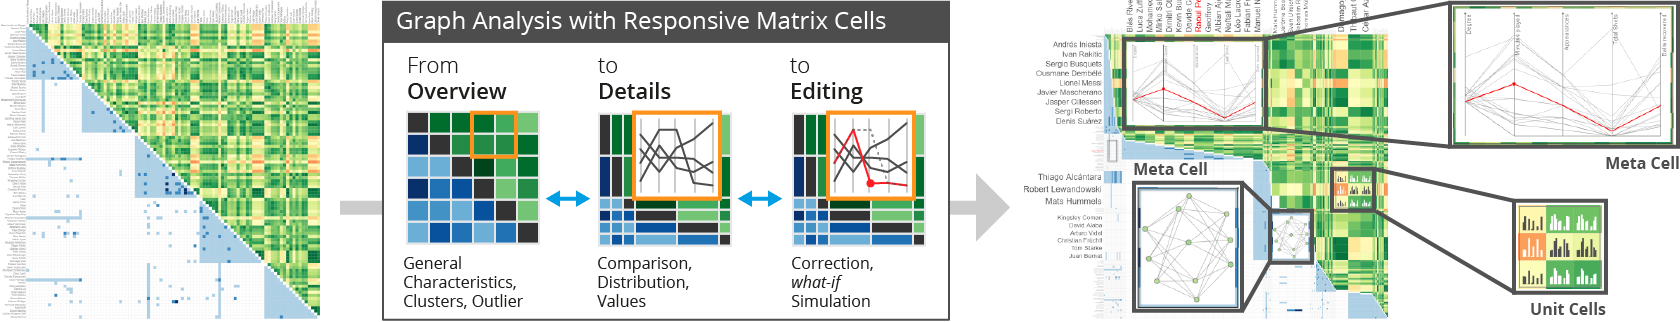
In the Graph session, Tom Horak and Philip Berger presented Responsive Matrix Cells. These cells combine focus and context to allow a seamless support for data exploration and editing of multivariate graphs. In turn, it is possible to shift focus from the overview in the matrix to bring up more details in the explored context. Pre-print, online prototype, videos, and more are available at imld.de/RMC.
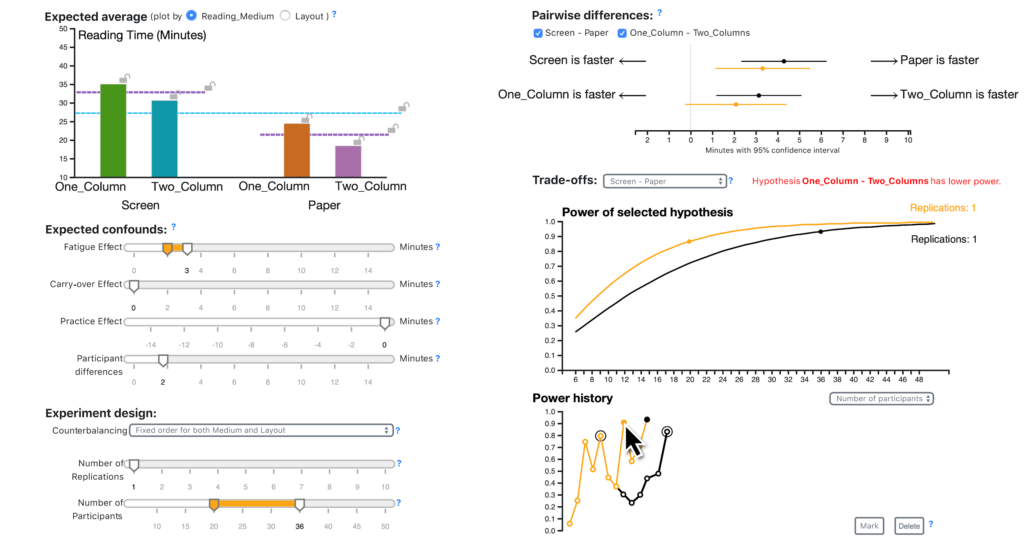
In the Intelligent Systems session, Argus: Interactive a priori Power Analysis was presented by Xiaoyi Wang. It helps design a controlled experiment by choosing the appropriate number of participants or sample size based on estimations. To better plan experiments, Argus assists users in exploring the relationship between sample size, effect size, confounds, and statistical power. For more details, please refer to the paper and the presentation.
In the Guidelines and Design Spaces session, two papers caught our attention: One addressed guidelines for better data abstractions and better hypotheses, while the other aligned data, algorithms, and models to support users in stacking tasks for ensemble learning.
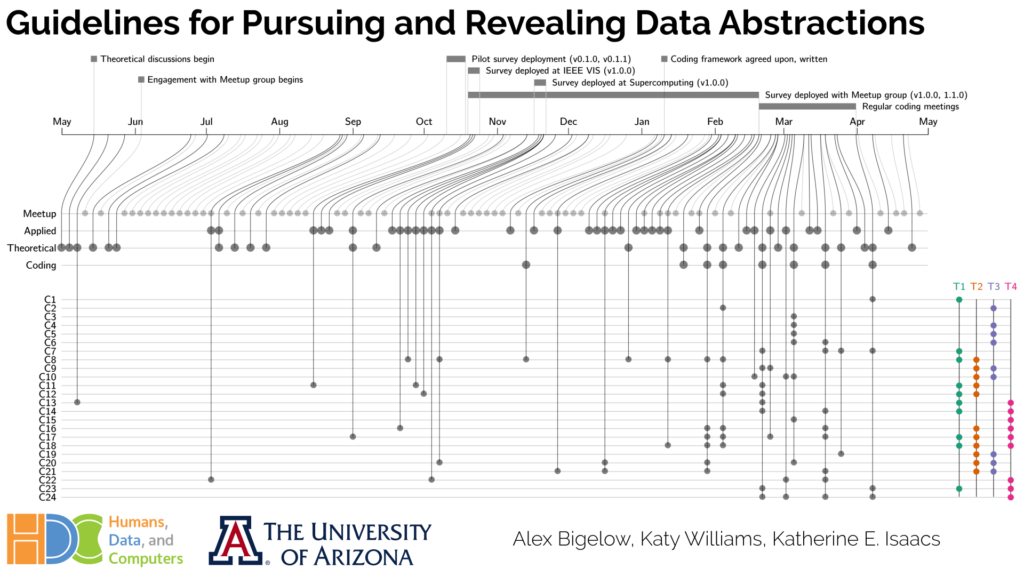
Alex Bigelow presented Guidelines For Pursuing and Revealing Data Abstractions. He addressed the way we think about data and how we engage with its representation, whether it is tabular, spatial, or in the shape of a network. His work focused on formulating better questions and discovering the blindspots in our own thinking. Alex went on to describe “abstraction typologies”, or ways to make sense of the different flavors of data abstractions that could exist, such as tabular vs. spatial data. He describes abstractions that people haven’t considered yet — that might be useful — as “latent abstractions”. Later on, Bigelow changed gears to consider abstractions as interventions. For more details, check out the paper and be sure to watch the quite engaging and enjoyable talk.
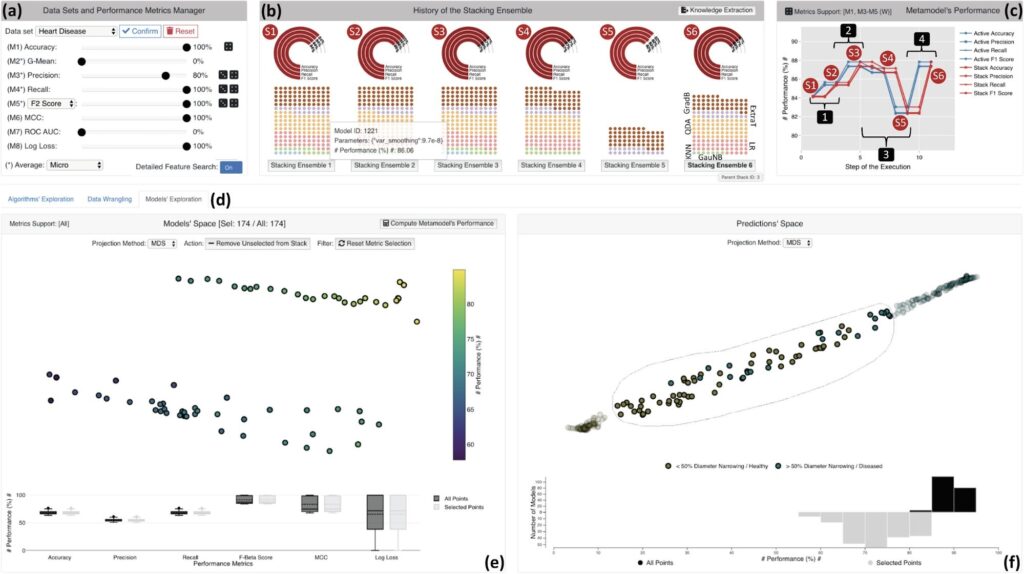
Angelos Chatzimparmpascan presented StackGenVis, which allows users to stack ensemble learning using performance metrics. While machine learning ensemble methods rely on bagging, boosting, and stacking, generating a stack of models from scratch can be a cumbersome trial-and-error process. This is especially problematic due to the large solution space and the possibilities that arise from having different algorithms, data instances, and features. StackGenVis alleviates this problem by supporting users through the use of visualization and a visual analytics system. This is possible thanks to dynamically adapting performance metrics, managing data instances, and selecting important features, choosing a set of performant algorithms, and measuring the predictive performance. For more on this work and to create your very own performance ensembles, you may refer to the paper or the presentation.
Restructuring and Future Directions: IEEE VIS 2021
In 2016, the VIS Executive Committee began an effort to restructure the IEEE VIS conference to reflect and enhance the energy and future directions of the visualization field. From 2016–2018, the VIS Restructuring Committee addressed these issues that culminated in recommendations accepted by the VIS Executive Committee. In February 2019, the reVISe Committee was formed to create a concrete proposal for re-organizing the academic conferences (VAST, InfoVis, and SciVis) into a unified conference.
These new directions will take effect for IEEE VIS 2021 and are highlighted in this VIS 2020 blog entry. The move toward unification specifically alters the current papers submission and review processes. As noted previously in this writing, the new umbrella event will be known as the IEEE Conference on Visualization and Visual Analytics. Please review the postings in the IEEE VIS 2020 Blog if you are interested in contributing to IEEE VIS 2021 and future conference events. If a live event can occur, IEEE VIS 2021 is slated to be held in the vibrant city of New Orleans with consideration also being given to continuing the virtual event as well.
Concluding Remarks
This particular Snapshot View of IEEE VIS 2020 has reflected our perspective on the weeklong premiere event in the field of visualization. Like SIGGRAPH or SIGGRAPH Asia, IEEE VIS is a complex event with many sessions and activities scheduled simultaneously. You can still view many of the IEEE VIS 2020 sessions on YouTube, or even attend the free virtual event by registering through the conference website. If you register, we hope you enjoy this forum as much as we did.
Want to learn more about IEEE VIS? Check out our 2019 snapshot.