By Theresa-Marie Rhyne and Min Chen
Image credit: Graphic recordings by Benjamin Felis of the IEEE VIS Technical Awards and the Test of Time and Keynote sessions (Fig. 1)
Data visualization is the study of the transformation of data into visual representations. It provides a cost-beneficial means for human users to utilize their perceptual and cognitive abilities to gain insight from data. Over 30 years ago in 1987, ACM SIGGRAPH published a landmark report on this subject entitled “Visualization in Scientific Computing” in which the National Science Foundation Panel on Graphics, Image Processing, and Workstations outlined a vision for developing computer-generated visualization as a scientific field. Since that time, the field has expanded to encompass the three major subfields of scientific visualization, information visualization, and visual analytics. It also includes numerous domain-specific areas, such as biological data visualization, geo-information visualization, and software visualization. Visualization has grown into an indispensable and enabling instrument in many fields. IEEE VIS is the largest worldwide conference in this field and is held in each autumn — this year in Berlin, Germany from 21–26 October. Here, we shine a spotlight on some of the memorable events from the 2018 forum.
The Venue
IEEE VIS 2018 was held at the Estrel Hotel in Berlin, Germany. Holger Theisel, of the University of Magdeburg, served as the General Chair of the conference, and the event encompassed a full week of research presentations, tutorials, workshops, panels, demonstrations, posters, arts programs, and exhibitions. As Theisel noted in his opening remarks: The event had 1,265 participants, which included “543 newcomers,” who were attending IEEE VIS for the first time, and most of the attendees were from the United States (346) and Germany (341). The “VIS 2018 At-A-Glance” diagram provides a visual overview of the conference, and a detailed program can be found on the IEEE VIS 2018 website.
The Keynote
Dieter Schmalstieg, professor and head of the Institute of Computer Graphics and Vision at Graz University of Technology in Austria, delivered the keynote address, “When Visualization Met Augmented Reality.” Schmalsteig noted that while a new generation of augmented reality (AR) games are engaging and appealing, non-entertainment AR applications have tended to be lacking in sophisticated content. He showed a few examples of AR-based visualization, and proposed that overlapping AR research with VIS research has the potential to improve this situation. Additionally, he noted that VIS needs to address the new medium of AR by embracing AR’s two key aspects of mobility and real+virtual perception.
The Capstone
Joachim M. Buhmann, professor of computer science and Vice Rector of Study Programmes at ETH Zurich, delivered the capstone address, “Can I believe what I see? – Information theoretic algorithm validation.” He provided an insightful argument that information theory provides machine learning with an underpinning foundation, and showed a number of examples where information-theoretic measures were used in the processes and applications of machine learning. His presentation prompted VIS attendees to build a theoretical foundation for visualization.
The Best Papers in Visual Analytics, InfoVis, and SciVis
Each year, the IEEE VIS event selects best paper awards from the three major tracks: Visual Analytics Science and Technology (VAST), Information Visualization (InfoVis), and Scientific Visualization (SciVis). “TPFlow: Progressive Partition and Multidimensional Pattern Extraction for Large-Scale Spatio-Temporal Data Analysis” by Dongyu Liu, Panpan Xu, and Liu Ren received the Best Paper Award in the VAST track; “Formalizing Visualization Design Knowledge as Constraints: Actionable and Extensible Models in Draco” by Dominik Mortiz, Chenglong Wang, Greg L. Nelson, Halden Lin, Adam M. Smith, Bill Hoe, and Jeffery Heer received the InfoVis track’s Best Paper Award; and, “Deadeye: A Novel Preattentive Visualization Technique Based on Dichoptic Presentation” by Audrey Krekhov and Jens Krueger received the Best Paper Award in the SciVis track. Each paper and those that received honorable mentions are listed here. IEEE VIS also had a series of Test of Time Awards for papers published at previous IEEE VIS conferences. You can find all papers that were presented at IEEE VIS 2018 published online in the IEEE Xplore digital library, as well as in the January 2019 issue of IEEE Transactions on Visualization and Graphics.
Other Interesting Finds
As you can see in the opening figure of this article, Benjamin Felis drew a number of graphic recordings for select IEEE VIS 2018 sessions. As he told us, “I work intuitively and mostly non-digitally but I think we should bring the two fields of graphic recording and visualization together since we can learn lots from each other.”
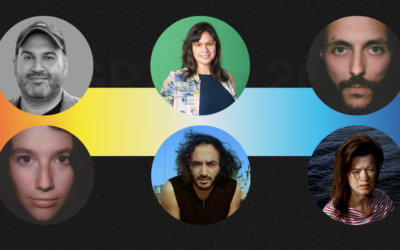
We were fascinated by the discussions generated by the interactions between art, design, and visualization.

Image credit: “Anthropocene Footprints” by Mieka West and Sheelagh Carpendale (Fig. 2)
IEEE VIS 2018 also included an arts program, VISAP’18, that showcased innovative artwork and research that explores the exciting and increasingly prominent intersections between art, design, and visualization. View a listing of the selected contributions to the art exhibition here. Figure 2 (above) features the work by Mieka West and Sheelagh Carpendale, entitled “Anthropocene Footprints.” As West noted in our interview with her, she was “inspired by the Quipu, or ‘talking knots,’ because it is one of the earliest examples of data visualization and because of its simplicity to construct. I tried to remain true of the spirit of the Quipu: making this work by hand, doing calculations by hand, using soft materials, and making my project wearable.” Quipu were recording devices created from strings and historically used by many cultures, specifically in the region of Andean South America. West and Carpendale used this approach to depict 48 pieces of environmental data, from Canada’s greenhouse gas emissions in different industries in 1990, 2010, and 2030 (predicted).
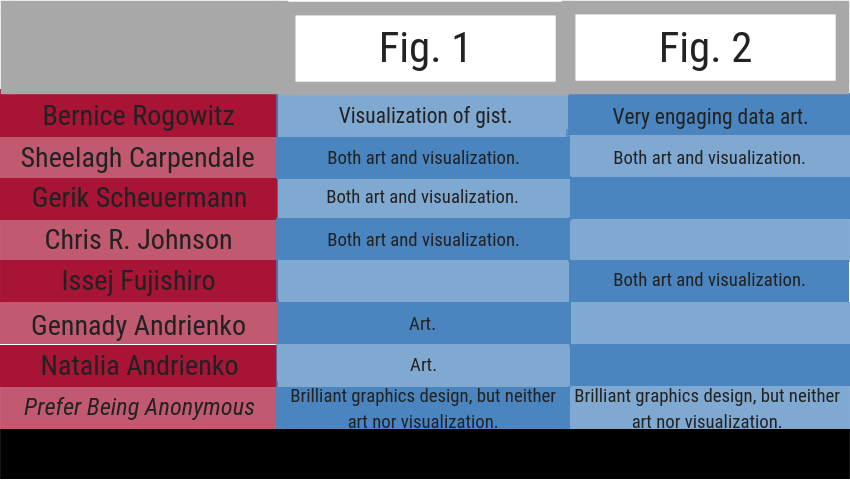
We also interviewed a number of visualization scientists, gathering their thoughts about the graphic recordings by Benjamin Felis and the Quipu by West and Carpendale. Standing in front of each work, we asked: “Is this art or visualization?” The responses are summarized in the figure below.
Concluding Remarks
The tremendous amount of work that went into organizing IEEE VIS 2018 and the amazing dedication shown by the various committee members and other volunteers was impressive. At the conference capstone event, Holger Theisel made the comment that “the student volunteers were always there when we needed them”. As Lisa Avila, Chair of VIS Executive Committee, noted “This year at VIS, there was significant energy focused on the future of the conference resulting in new initiatives for 2019 to expand diversity and attract broader participation”. IEEE VIS 2019 will be held in Vancouver, Canada from October 20-25, 2019.
About the Authors
Theresa-Marie Rhyne is Visualization Consultant(theresamarierhyne@gmail.com) and is author of the book “Applying Color Theory to Digital Media and Visualization,” published in 2016 by CRCPress. Min Chen is Professor of Scientific Visualization at University of Oxford ( min.chen@oerc.ox.ac.uk) and is one of the authors of the book “Information Theory Tools for Visualization,” also published in 2016 by CRC Press.