SIGGRAPH chats with 2023 Labs contributor Ann McNamara about her hands-on class “Building Maps on the Web Using RStudio, Leaflet, and Shiny.”
ACM SIGGRAPH Blog
Category
Data
A Day Dedicated to Educators
8 August 2022 • by SIGGRAPH ConferencesACM SIGGRAPH, Animation, Conferences, Data, Design, Education, Graphics, Industry Leaders, Interactive Techniques, Research, Students
The inaugural SIGGRAPH 2022 Educator’s Day aimed to shape the next generation of students by providing hands-on learning opportunities for educators.
Piecing Together the Puzzle Behind the Tulsa Race Massacre
23 June 2022 • by SIGGRAPH ConferencesAugmented Reality, Conferences, Data, Design, Graphics, Interactive Techniques, Research, Virtual Reality
Graphics editors from The New York Times discuss the use of geo-spatial data analysis, 3D, and machine learning to recreate the neighborhood destroyed during the 1921 Tulsa Race Massacre.
A Conversation on Curating: ARTECHOUSE’s ‘Life of a Neuron’
28 February 2022 • by SIGGRAPH ConferencesArt, Data, Design, Graphics, Interactive Techniques, Research
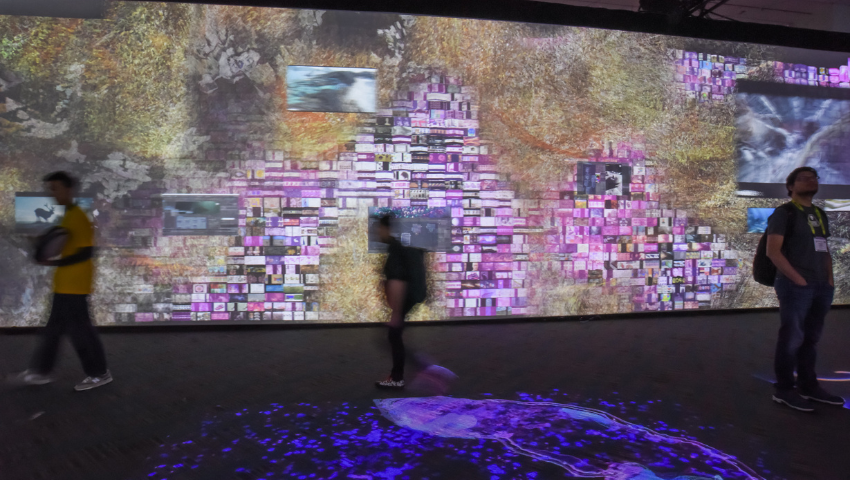
Spend your day walking through a neuron. Learn more about ARTECHOUSE’s “Life of a Neuron” exhibit, and become immersed in the mystery of the human brain.
How She Inspires: Black Girls CODE Founder Kimberly Bryant
17 February 2022 • by SIGGRAPH ConferencesBusiness, Data, Education, Industry Leaders, Students
SIGGRAPH sits down with Black Girls CODE Founder Kimberly Bryant to talk about her background and how she inspires others.
Using Biosignals to Memorialize Beloved Animals
18 November 2021 • by SIGGRAPH ConferencesArt, Conferences, Data, Interactive Techniques, Research, Students
We are gathered here today to discuss “ReMember” and how it uses audiovisual effects to create memorials for pet owners’ companion animals.
A Snapshot View of IEEE VIS 2021
17 November 2021 • by Theresa-Marie Rhyne and Georges HattabArt, Awards, Data, Graphics, Research
Theresa-Marie Rhyne and Georges Hattab recap the recent IEEE VIS 2021 event.
CG market to reach $160 billion by 2024
14 July 2021 • by Jon PeddieBusiness, Data, Interactive Techniques
Jon Peddie Research (JPR) shares data on how the CG market and industry will increase to 2% CAGR growth over the next few years.
Fluid, Feminine, and Ecological Data Visualization
6 January 2021 • by SIGGRAPH ConferencesArt, Conferences, Data, Research
Discover the science and method behind student thesis project “Tsuga Convictio”, a 2020 selection of the IEEE VIS Arts Program.
A Snapshot View of IEEE VIS 2020
18 November 2020 • by Theresa-Marie Rhyne and Georges HattabConferences, Data
Theresa-Marie Rhyne and Georges Hattab recap the recent IEEE VIS 2020 event.
‘Homeostasis’ and Human Interference
30 April 2020 • by SIGGRAPH ConferencesAnimation, Art, Conferences, Data, Design, Graphics, Interactive Techniques, Visual Effects
In SIGGRAPH 2020 Art Gallery selection, “Homeostasis,” Emil Polyak uses complex coding and development to narrate the human impact on climate change, as told by data.
A Snapshot View of IEEE VIS 2019
5 December 2019 • by Theresa-Marie RhyneAnimation, Data, Graphics
Theresa-Marie Rhyne recaps the premiere conference on scientific visualization (SciVis), information visualization (InfoVis), and visual analytics (VAST).


