
“The History of 3D in Computers” © Jon Peddie
As SIGGRAPH celebrates its 50th conference, it is time to not only look toward the future but also take a look back at the past. Many changes have occurred since the first SIGGRAPH conference in 1974, and we invite you to research, analyze, synthesize, and visualize some aspects of the changes that have occurred. SIGGRAPH 2023 will be showcasing posters and screen-based works that visually present the history of computer graphics and/or interactive techniques in a unique and engaging way in the “50 Years at a Glance”exhibit, a component of the SIGGRAPH’s 50th conference celebration.
What Is 50 Years at a Glance?
Over the past 50 years, computer graphics and interactive techniques have evolved from the fundamental developments in shading algorithms in the 1970s to the current evolution of AI and virtual worlds. Innovative research and creative applications of computer graphics have been presented as Technical Papers, artworks, Emerging Technologies demos, virtual reality experiences, computer animations, and more at the annual SIGGRAPH conferences. Information about the presentation of this work is currently being added to the SIGGRAPH History Online Archive.
“50 Years at a Glance” is a showcase of posters and screen displays that visualize some aspects of computer graphics and interactive techniques. This is a special exhibit, separate from the Posters program, specifically for the SIGGRAPH 50th conference celebration. It will feature posters and screen displays that creatively visualize changes in computer graphics, interactive techniques, and the conference itself over the past 50 years.
For instance, the poster or interactive screen display could:
- Explore how Emerging Technologies have changed over time at the SIGGRAPH conference.
- Compare the latest technologies with those of previous decades.
- Depict how SIGGRAPH conference programs and venues have changed since 1974.
- Visualize the various approaches to app development as showcased in Appy Hour.
- Analyze how the artwork in the Art Gallery has evolved since the first show in 1981.
- Explore how members of the SIGGRAPH community, artists, researchers, animators, educators, students, practitioners, and others are related to each other or to companies, labs, institutions, etc.
- Investigate how education has changed over the years in the field of digital arts and computer science.
- Create a timeline of seminal computer animations over the past 50 years.
- Or come up with your own ideas!
What Forms of Information Visualization Is SIGGRAPH 2023 Seeking?
SIGGRAPH 2023 is seeking well-designed information visualization that analyzes trends or changes based on a collection of information. The visualization could be a poster highlighting relationships or trends, such as a timeline, graph, diagram, or map, or it could be the creation of artistic images using data related to SIGGRAPH’s past 50 years.
Some examples of information visualization include:
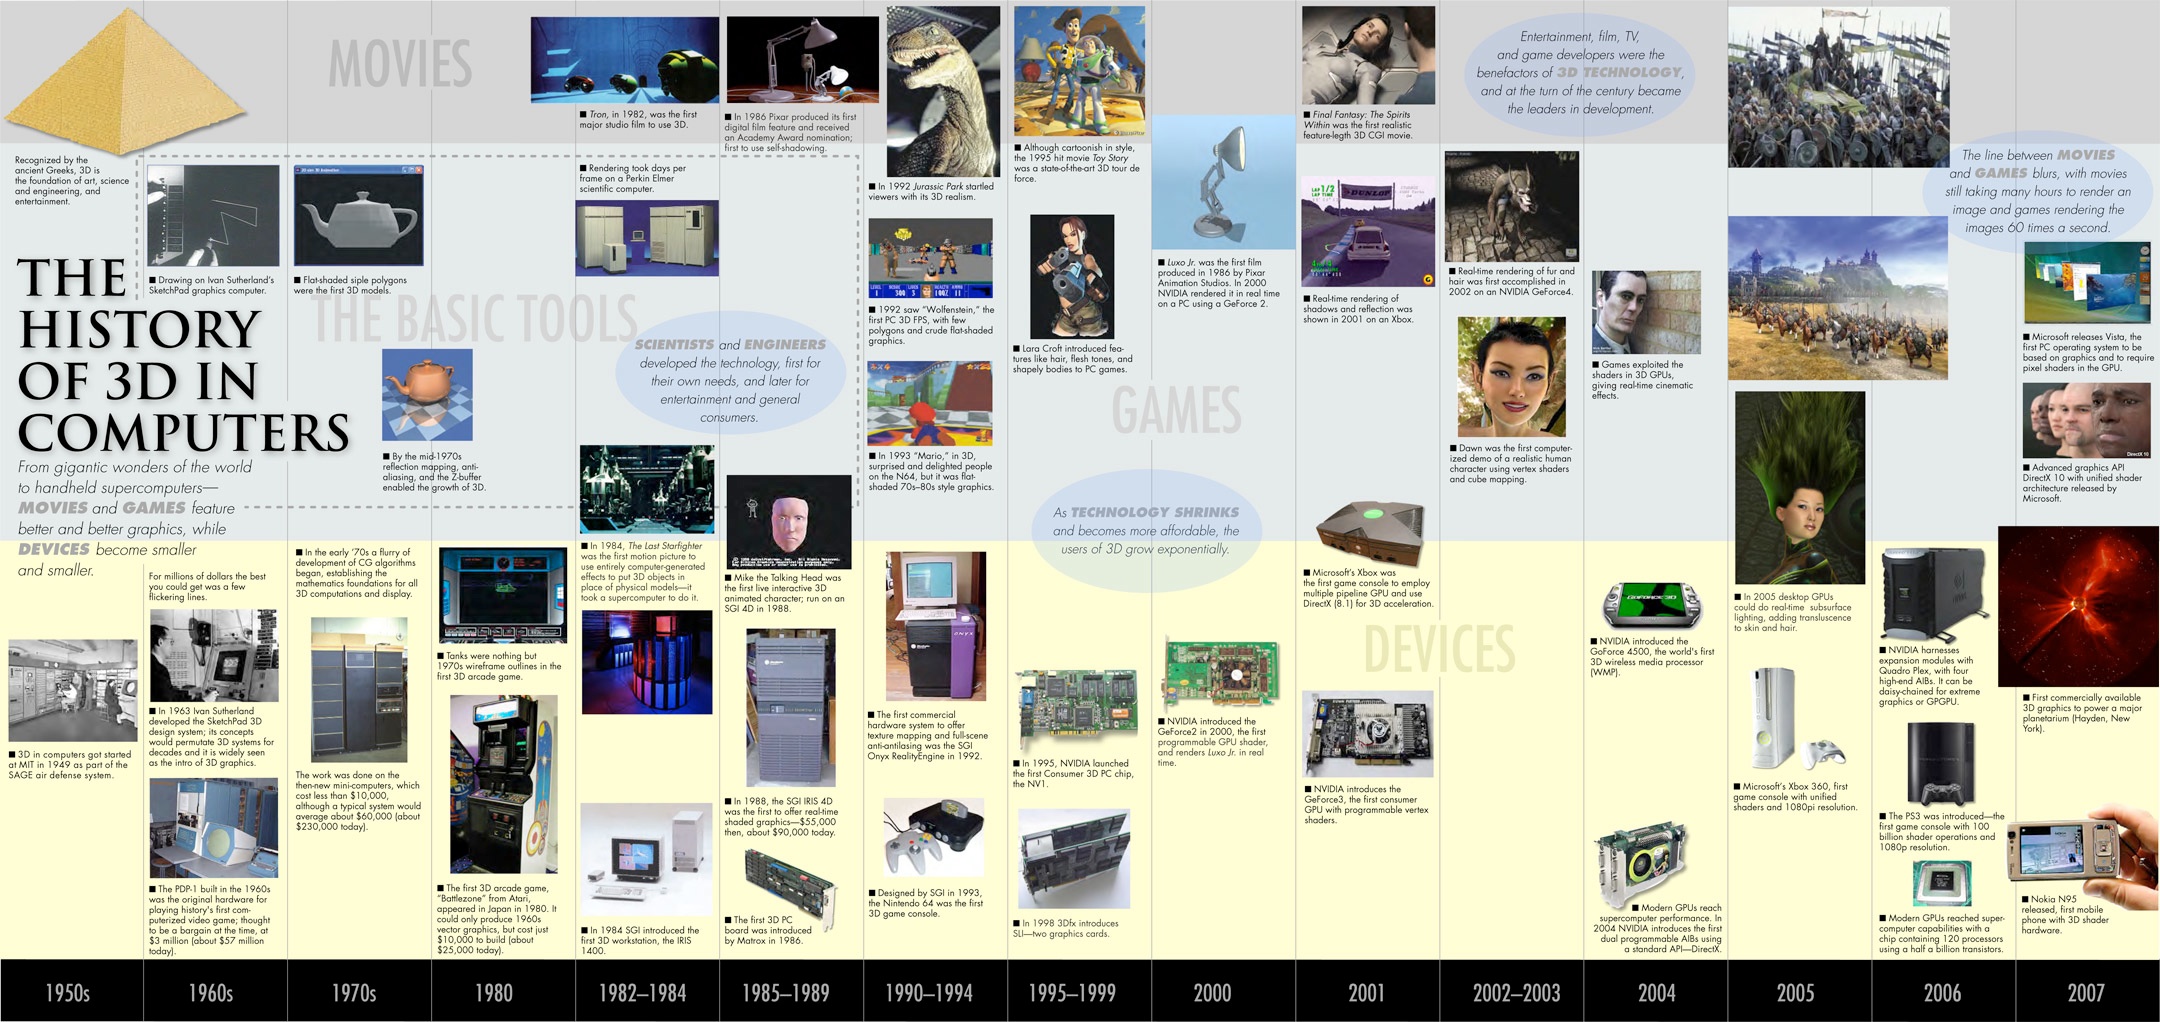
- “The History of 3D in Computers” poster by Jon Peddie in collaboration with Nvidia, showing the timeline of 3D computer technology from the 1950s to 2007. This poster went on to inspire the book “The History of Visual Magic in Computers.”
- SIGGRAPH 2009’s Information Aesthetics Show chaired by Victoria Szabo, featuring creatively designed posters created using data, such as Yosushi Noguchi’s “C-loc Software” and Boris Mueller’s “VisualPoetry – Generative Graphic Design for Poetry on the Road.”
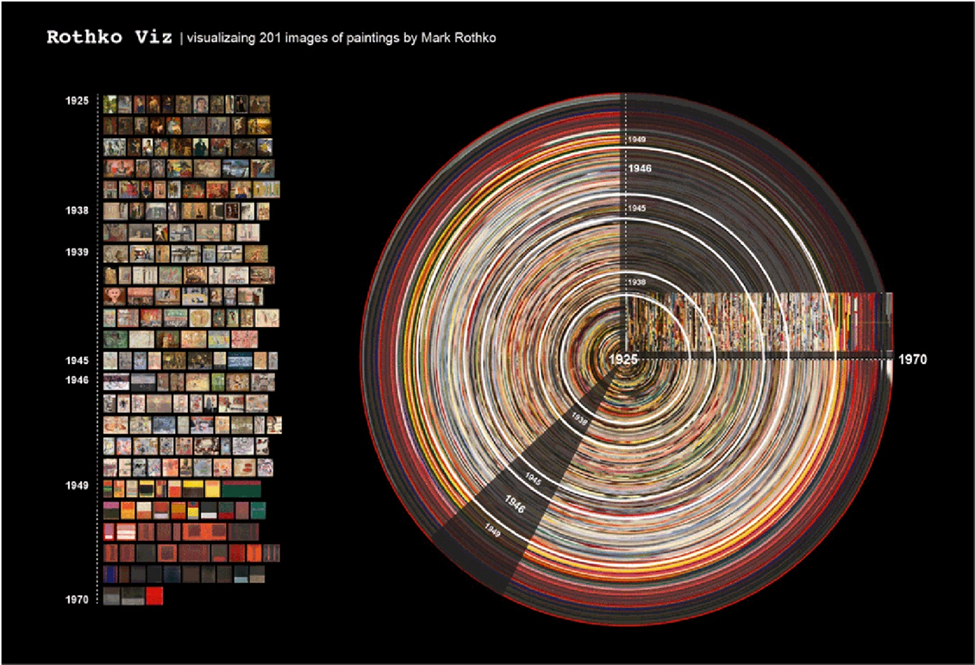
“RothkoViz” © Everardo Reyes
We invite you to take a look at the past 50 years of computer graphics and interactive techniques at the SIGGRAPH conference and dive deeper to explore and reveal hidden patterns, trends, and relationships. Submit to the SIGGRAPH History program by 22 February. We look forward to showcasing your work at the SIGGRAPH 50th celebration in the “50 Years at a Glance” showcase!
Check out this article to learn more about how you can envision the future of SIGGRAPH and submit to the History program by 22 February.
